

Artificial intelligence for trading has shed its reputation as a mysterious black box. It has become a genuine analytics tool for anyone dealing with crypto and the markets.
In 2025, people use artificial intelligence in crypto trading not to run fully automated flows, but to better understand what's happening with liquidity, on the charts, and in the news cycle.
Neural networks help filter genuinely useful signals out of the noise, spot anomalies, test hypotheses, and gauge how stable the market is at any given moment.
In this article we'll cover:
- How does a neural network for trading actually work?
- What can these models demonstrate?
- How do you work with them?
Using the GPTunneL aggregator, we tested several neural networks in a crypto-market context and put together some practical tips for traders.
How to use AI in trading
AI for crypto trading is an effective assistant that processes information far faster than a human. Neural networks aren't prone to emotional reactions to events, so their conclusions tend to be more objective and level-headed.
AI for trading in the markets:
- Quickly processes large volumes of scattered information;
- Instantly analyzes the news feed;
- Easily picks up on market sentiment;
- Catches even minor price shifts;
- Assesses liquidity and volumes;
- Identifies stable and temporary correlations.
A properly configured neural network for crypto trading clears the noise out of a trader's information field, flags where information doesn't match expectations, and helps stress-test your own hypotheses. AI can also highlight risks, which is especially important when the market is unstable.
That's how modern trading signals are formed today: a neural network provides not so much ready-made recommendations as structured information meant to help buyers and sellers understand what's happening in the market.
How to use artificial intelligence in trading: 5 directions for market analysis
Trading with a neural network starts with picking an AI model suited to a specific analytical task. Below we break down 5 ways to apply artificial intelligence to crypto market analysis from different angles.
Market sentiment analysis
Sentiment analysis lets you quickly gauge what mood is forming around an asset under the influence of related news. It can also help estimate the probability of a short-term price impulse.
Claude 4.5 Sonnet, which breaks down information in detail and reads context well, and GPT-5.1, which excels at structuring data and calculating probabilities, both shine at this kind of task. We tested both neural networks using real news about bitcoin.
Prompt:
"Analyze three news items about Bitcoin:
- https://www.reuters.com/business/czech-central-bank-buys-1-mln-bitcoin-other-crypto-assets-testing-2025-11-13/
- https://m.economictimes.com/markets/cryptocurrency/bitcoin-rebounds-4-from-recent-lows-to-91775-whale-wallets-hit-4-month-high/articleshow/125427804.cms
- https://www.theguardian.com/uk-news/2025/nov/11/fraudster-who-hid-in-london-is-jailed-over-bitcoin-scam
Generate a sentiment score, highlight the triggers, and estimate the probability of a short impulse."
Result
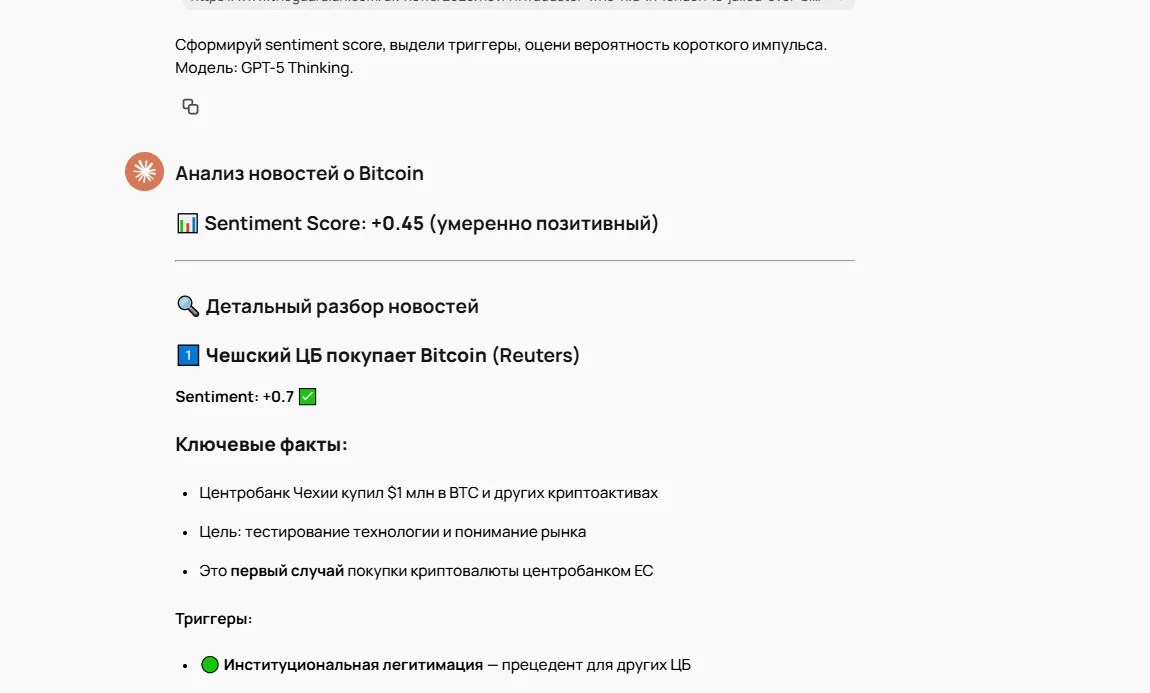
Both models agreed that the BTC news backdrop could be described as moderately positive:
- The purchase of bitcoin by a central bank was interpreted as institutionally significant, even given the symbolic size of the amount;
- The bounce, amplified by whale activity, points to a bullish factor, albeit a short-term one;
- The fraud story has little impact on price and reads more like reputational noise.
Average sentiment landed in the +0.35–0.45 range, and the probability of a short-term impulse was 0.7–0.8. See the result here.
Forecasting based on news and micro price movements
For short-term forecasting of price movement on minute candles, the best-suited model is GPT-5.1. The model is capable of:
- spotting micro-signals;
- matching volume spikes to the appearance of crypto news;
- building out scenarios.
We used a file of minute-level ETH data and asked the model to identify micro-anomalies that resembled news reactions, then generate a 6-hour forecast.
Prompt:
"Use the minute-level ETH OHLCV data file:
"/mnt/data/minute_CryptoCompare_Index_ETH_USD_1691_51763919648817 for prompt 2.csv"
Find micro-anomalies that drive short-term impulses, match them to likely news windows, and build a 6-hour forecast for ETH."
Result
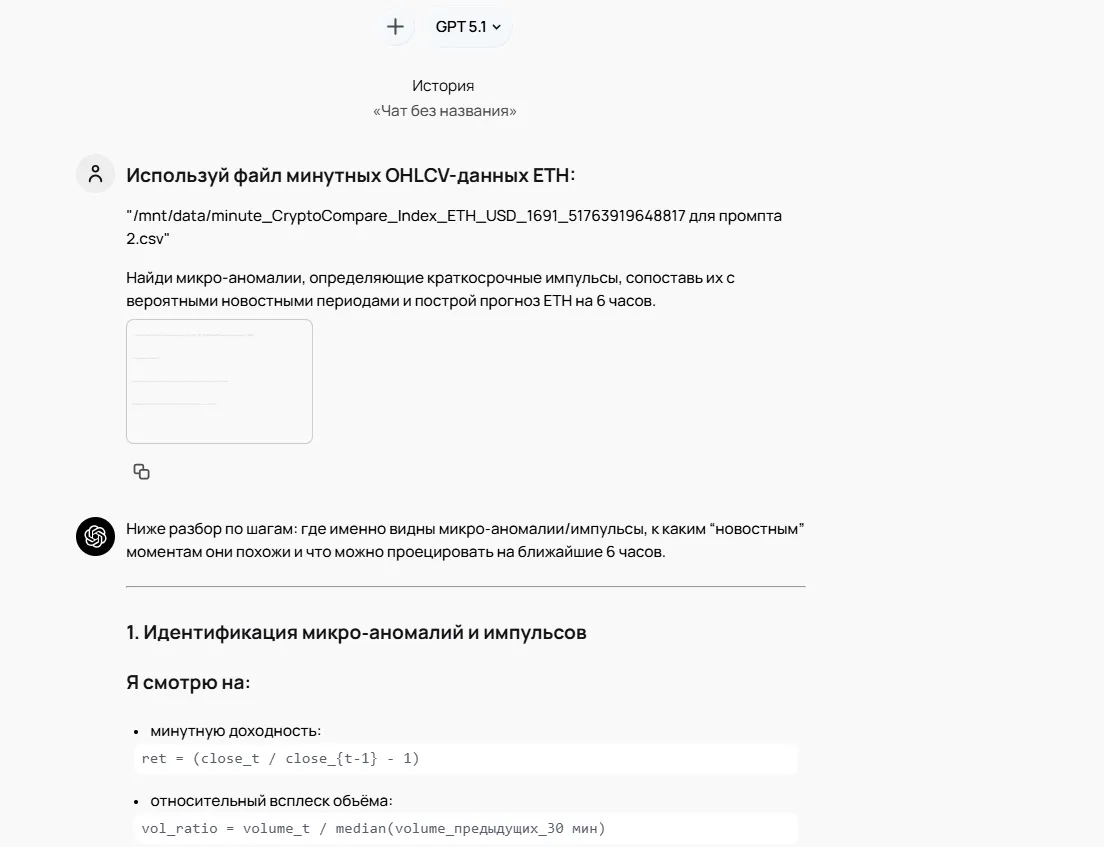
GPT-5.1 identified 6 micro-impulses, each accompanied by a sharp increase in volume and price acceleration. A couple of these impulses look like a possible reaction to positive news, one looks like a classic overheating followed by an instant pullback, and the last one looks like a likely negative catalyst that pushed traders to sell off assets rapidly.
After this series of impulses, the market formed a peak, quickly corrected, and moved into a phase of fading volatility.
The model forecasts a sideways range of 2780–2830 over the next 6 hours, with occasional attempts to return to 2840 and support around 2785–2800. See the result here.
Identifying anomalies in the data (liquidity anomalies, spoofing)
Anomaly detection is one type of analysis where DeepSeek R1 performs best. The model reliably catches:
- Volume spikes;
- Liquidity gaps;
- Fake orders;
- Patterns resembling spoofing.
To test this neural network for trading, we fed it an artificially generated set of minute-level data, enriched with real market features: sharp volume spikes, activity clusters, and areas with fast reversals.
Prompt:
"Use the file:
"/mnt/data/MATICUSDT-5m-2025-10-22-synthetic.csv"
Find volume spikes, liquidity gaps, and spoofing patterns. Note timestamps and build a table of suspicious zones."
Result
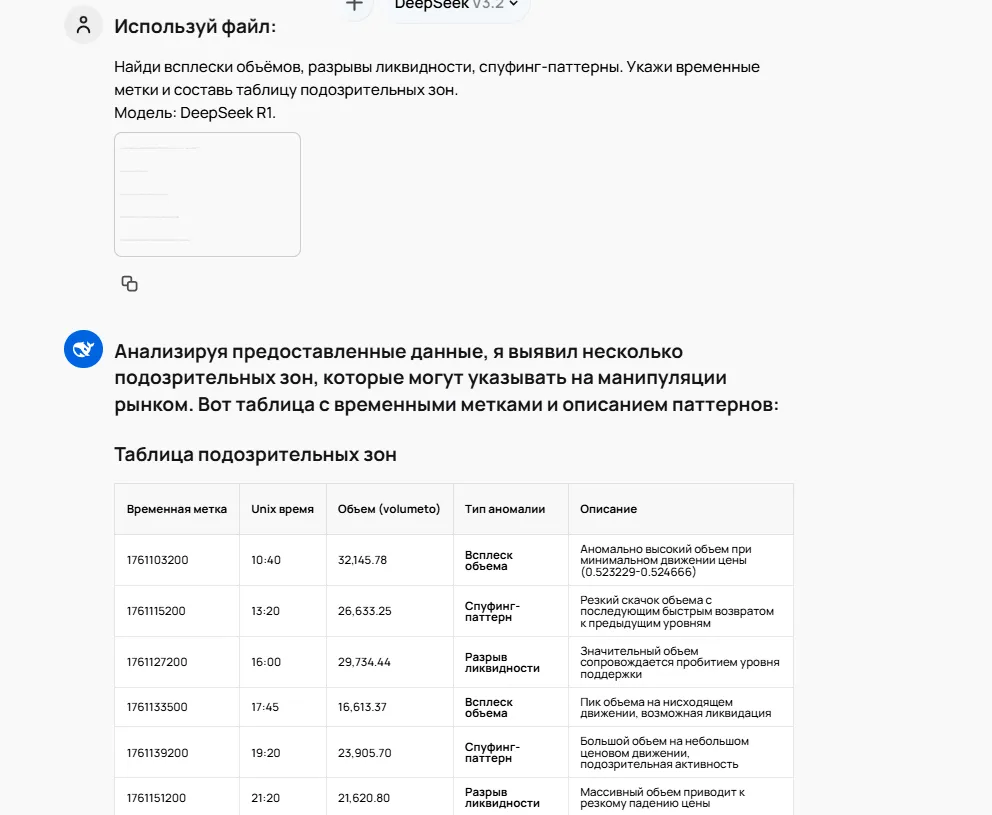
DeepSeek flagged 10 suspicious moments and sorted them into three categories:
- Spoofing patterns: a sharp rise in volume with no visible effect on price — a sign that fake large orders had entered the picture;
- Liquidity gaps: 3–6 times above normal, breaking through local levels;
- Volume spikes: volume rises while price barely moves — a typical sign that major players have become active.
The model correctly identified "spike → instant pullback" patterns, flagged clusters of artificial volume, and highlighted the most critical zones. See the result here.
Correlations and cross-market relationships
Correlation analysis helps you understand how the crypto market reacts to macroeconomic dynamics. One of the most persistent relationships is between bitcoin and the dollar index (DXY).
To check whether neural networks can handle correlation analysis, we tested Perplexity Sonar Pro. The model is known as a strong analyst that handles time series easily and produces accurate statistical conclusions. Again, we fed it an artificially generated but plausible CSV file with 60 days of BTC prices and dollar index values.
Prompt:
"Use the file: "/mnt/data/dxy_btc_synthetic_60d.csv"
Build the correlation between BTC_USD_close and the DXY_index. Find periods of divergence and assess whether the dollar leads BTC's dynamics."
Result
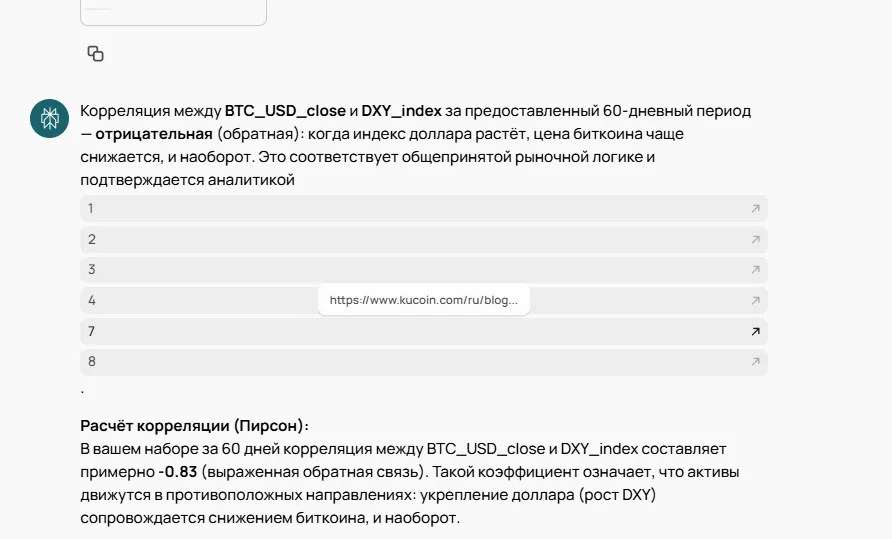
Perplexity delivered a confident and, importantly, accessible statistical breakdown.
Over 60 days, the correlation between BTC and the dollar index turned out to be strongly negative (≈ -0.83). The model flagged several short periods where both assets moved in the same direction, but stressed that these divergences don't break the overall inverse relationship.
Important: Sonar Pro found that DXY dynamics often lead bitcoin-related changes by a day or two, especially when the dollar makes a sharp reversal. A rising index almost always means falling BTC prices, while a weakening USD tends to boost demand for bitcoin. See the result here.
Risk modeling and scenario forecasting
Scenario analysis is one of GPT-5.1's strongest suits. The neural network handles multi-factor hypotheses well, can build out probability-based scenarios, and carefully maps them to key market levels.
For testing, we used a pre-built CSV file with five trading hypotheses for the S&P 500: from the impact of real rates to Q4 seasonality and rising geopolitical risk. The model's task was to analyze each hypothesis and provide bullish, base, and bearish scenarios, assessing risks and the impact of the 4800–5050 levels, which are key for index tactics.
Prompt:
"Use the file:
"/mnt/data/spx_hypotheses_formalized.csv"
For each hypothesis, build bullish/base/bearish scenarios, assess risks, weak points, and the impact of the 4800–5050 levels."
Result
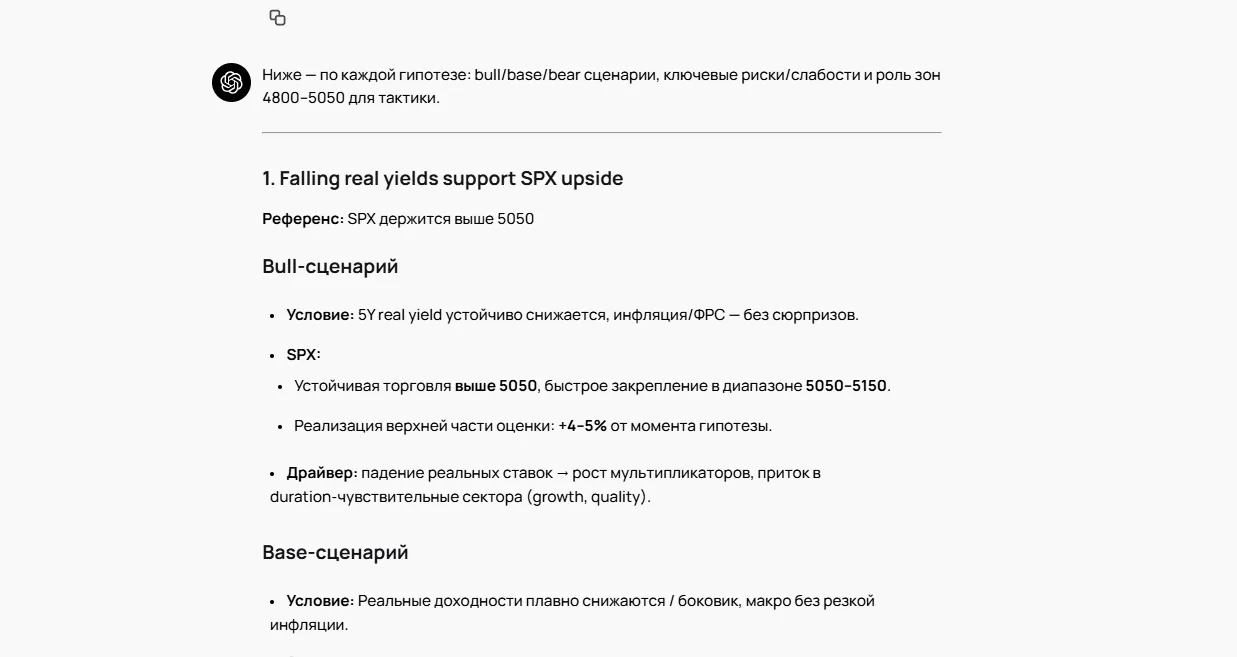
GPT-5.1 analyzed all 5 hypotheses in detail and produced material close to an expert report.
Conclusions the neural network reached:
- for most hypotheses, the 5050 level acts as a "line of strength": holding above it confirms bullish scenarios (falling real rates, seasonal tailwinds, mega-cap tech leadership);
- 4900–5000 is a balancing zone: the market could stay range-bound even under a moderately negative backdrop;
- 4800 is the level where bearish scenarios take hold: rising oil, geopolitical escalation, rising real yields, or a breakdown in mega-cap tech leadership.
The AI provided detailed bullish, base, and bearish scenarios for each case. Each scenario outlines drivers, risks, and the logic behind the index's movement. This format is especially useful when putting together short- and medium-term trading plans. See the result here.
How to choose a neural network for trading
It all depends on exactly what you need to analyze:
- News flow;
- Micro price movements;
- Cross-market correlations;
- Possible index movement scenarios.
There's no universal model that covers every trader's need. That's why crypto traders combine neural networks, splitting tasks between them as part of a comprehensive analysis. This approach clears the noise out of the information field, speeds up hypothesis testing, and makes market analysis more consistent and reproducible.
Below is a table of the neural networks we used in our tests, and why a given AI turned out to be the best fit for a specific task.
Trader's cheat sheet: 9 universal prompts
News impulse analysis
Data: links to recent news (2–4 items)
Prompt: "Analyze the news for [ASSET]: [PASTE 2–4 NEWS LINKS]. Generate a sentiment score, highlight the triggers, and estimate the probability of a short impulse."
Micro-anomalies in intraday candles
Data: CSV with 1-minute or 5-minute OHLCV (exported from Binance/Bybit/TV)
Prompt: "Use the OHLCV file for [ASSET] (1m or 5m): [PASTE CSV]. Find micro-anomalies: volume spikes, liquidity gaps, atypical candles."
Detecting manipulation: spoofing, fake volumes
Data: any CSV with 1m–15m candles and volumes
Prompt: "Analyze the candle data: [PASTE CSV WITH OHLCV]. Find volume spikes, liquidity gaps, and spoofing patterns. Build a table of suspicious zones."
Sentiment for a token or the market
Data: news links + social media posts
Prompt: "Build a sentiment score for [ASSET] over the past 24 hours. Use news and social media. Identify which events are reinforcing the trend."
Correlations between assets
Data: two CSVs of price history (any frequency: daily, 1h, 15m)
Prompt:
"Calculate the 30–60-day correlation between [ASSET 1] and [ASSET 2]. Use two CSVs:
- [PASTE CSV 1]
- [PASTE CSV 2]
Determine which pair gives the best indicator for a pairs trade."
Macro vs crypto: BTC vs DXY or any pair
Data: CSV with a macro index (DXY/SPX/VIX/WTI) + CSV with asset prices
Prompt:
"Use two files:
- [CRYPTO_ASSET] quotes,
- [MACRO_INDEX] quotes.
Build the correlation, find divergences, and assess which one leads the movement."
Bullish, base, bearish scenarios
Data: key levels, market sentiment, your own observations
Prompt:
"Build bullish, base, and bearish scenarios for [ASSET] over 7–30 days. Use these levels: [PASTE LEVELS]. Assess risks, probabilities, and weak points for each scenario."
Testing trading hypotheses
Data: a list of hypotheses (as text or a CSV table)
Prompt:
"Analyze my market hypotheses: [PASTE LIST OR CSV]. For each one, estimate probability, risks, and confirmation/invalidation levels."
Impulse analysis
Data: any high-frequency OHLCV CSV (1m/5m)
Prompt:
"Analyze this OHLCV CSV for the asset: [PASTE OHLCV CSV]
Output:
- key impulses and volume spikes,
- microstructure anomalies,
- likely reversal levels,
- a short-term direction forecast."
Play to your models' strengths: DeepSeek R1 emphasizes statistics and anomalies, while GPT-5.1 focuses on interpretation and scenarios.
Conclusion
Trading with artificial intelligence is a way to quickly analyze the market and make decisions based not on emotion but on cold calculations and forecasts.
Comprehensive analysis is essential in trading. But to get a reasonably accurate forecast out of neural networks, it's important to break the analytics down into several tasks. And for each of those tasks, you need to use the model best suited to it. One AI reads news and market sentiment better, another catches anomalies and spoofing, and a third carefully lays out scenarios and risks.
The combined effect of using neural networks will save a trader significant time and help make more balanced, well-considered decisions.